Plotting 3D Surfaces
Surface plotting creates a 3D surface plot of a given matrix z. Entries
of z are used as height values. It is also possible to specify x and
y locations corresponding to each point in z . If a terminal with
interactive capabilities is being used by Gnuplot backend (like x11 or
wxt or qt), then rotating, zooming is also possible.
gnuplot.splot(z)
Plot surface z in 3D.
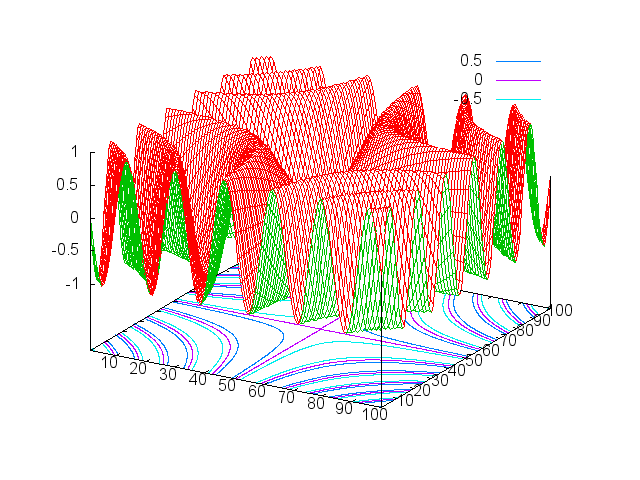
x = torch.linspace(-1,1)
xx = torch.Tensor(x:size(1),x:size(1)):zero():addr(1,x,x)
xx = xx*math.pi*6
gnuplot.splot(torch.sin(xx))
It is also possible to specify the x and y locations of each
point in z by gnuplot.splot(x,y,z). In this x and y has
to be the same shape as z.
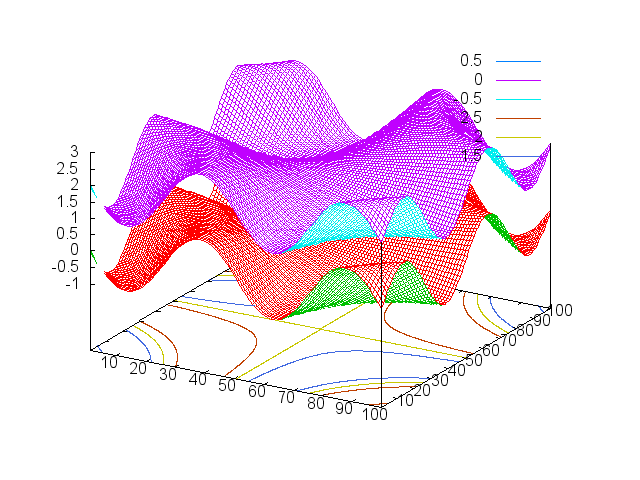
One can also display multiple surfaces at a time.
x = torch.linspace(-1,1)
xx = torch.Tensor(x:size(1),x:size(1)):zero():addr(1,x,x)
xx = xx*math.pi*2
gnuplot.splot({torch.sin(xx)},{torch.sin(xx)+2})