Histograms
Given a tensor, the distribution of values can be plotted using
gnuplot.hist function.
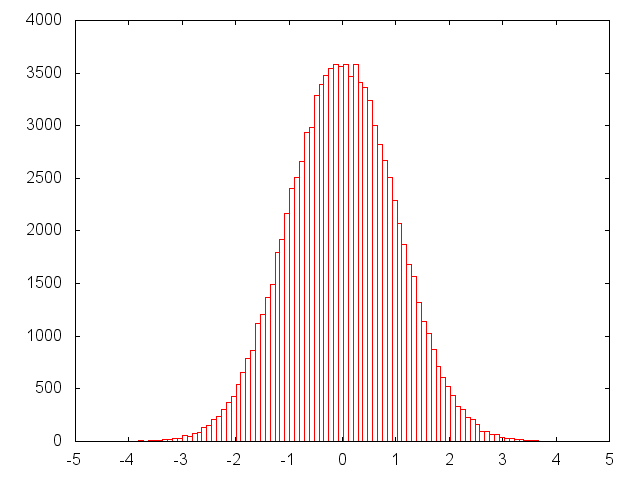
gnuplot.hist(x, [nbins, min, max])
Plot the histogram of values in N-D tensor x, optionally using nbins
number of bins and only using values between min and max.
gnuplot.hist(torch.randn(100000),100)